Back to all work
FIT – An AI driven platform to modernize commercial real estate brokerage
March 14, 2020
Company: Topos
Collaborators: Sam Coxon, Ria McIlwraith, Eric Buth, Ellery Royston, Sam Burns, Carlo Bailey, Mahir Yavuz, Bo Han
Roles: product design, algorithm design, front end development
Commercial real estate brokerage is an old-fashion industry that is starting to experience a wave of innovation. AI tools able to process massive amounts of data are introducing efficiencies that weren't previously possible. Commercial brokerages are beginning to realize that if they don’t become data, tech, and AI leaders, they will be left behind. In this case study, I will talk about how I helped build FIT, an AI-driven platform meant to both provide unique efficiencies into brokers’ workloads and nudge them into better decision-making.

Tenant and Landlord Reps: Two sides of the same coin
There are two types of commercial brokers – tenant reps and landlord reps. Tenant reps are those who work for retailers and franchisors who want to rent a space. Landlord reps are those who work for a landlord who wants to a lease a space. While these two types of brokers are ultimately fulfilling different roles in the marketplace, both jobs require much of the same time-consuming and monotonous work — pitching to clients, keeping up with multiple sources, prospecting new business opportunities, and maintaining a deep knowledge of an ever-changing commercial landscape. Being a good commercial broker necessitates a laborious boots-on-the-ground approach; deals simply can’t happen without it.
What is FIT?
At its heart, FIT is an intelligent lead generation tool that empowers brokers to make more and better deals without having to do the heavy lifting on analytics. It provides landlord reps instant access to qualified tenants and their site selection preferences and it provides tenant reps with instant identification of ideal growth strategies and retail corridors. We attempted to take the most time-consuming aspects of a brokers workload and reimagined them using simple UX and intelligent AI. In other words, FIT is essentially a broker’s secret weapon.
What was my role?
My role in this project was as the lead front-end developer, as a member on the product research and design teams, and as a back-end and data science collaborator. Topos is a small company, which allowed me to wear many different hats while working on this project. As someone who understands the technical concerns of the back-end along with the technical, design, and user requirements of the front-end, I was the link between all the teams.
On the front-end side of things, I decided to build a client using React and a server using Apollo GraphQL. Other technologies used were Deck.gl for the maps and d3-contour for the zones algorithm I created — both of which will be discussed in a moment.
Landlord Rep Flow: Starting with an address
The landlord flow starts off with a single address and a customizable trade area
The Landlord Rep Flow is designed for brokers that are looking for tenants for a specific address. We designed and built this flow with three goals: (1) Help brokers quickly and holistically understand a customizable trade area around a site. (2) Curate a "hit list" of prospective tenants from local to multinational brands. (3) Quickly, and without the need for an analyst, generate reports to persuade prospective tenants.
Understanding The Neighborhood: Building The Occlusion Layer
Before FIT, brokers would need to spend hours driving around a neighborhood just to get a sense of what it is like — and they might painstakingly make aerial maps to understand its commercial landscape.
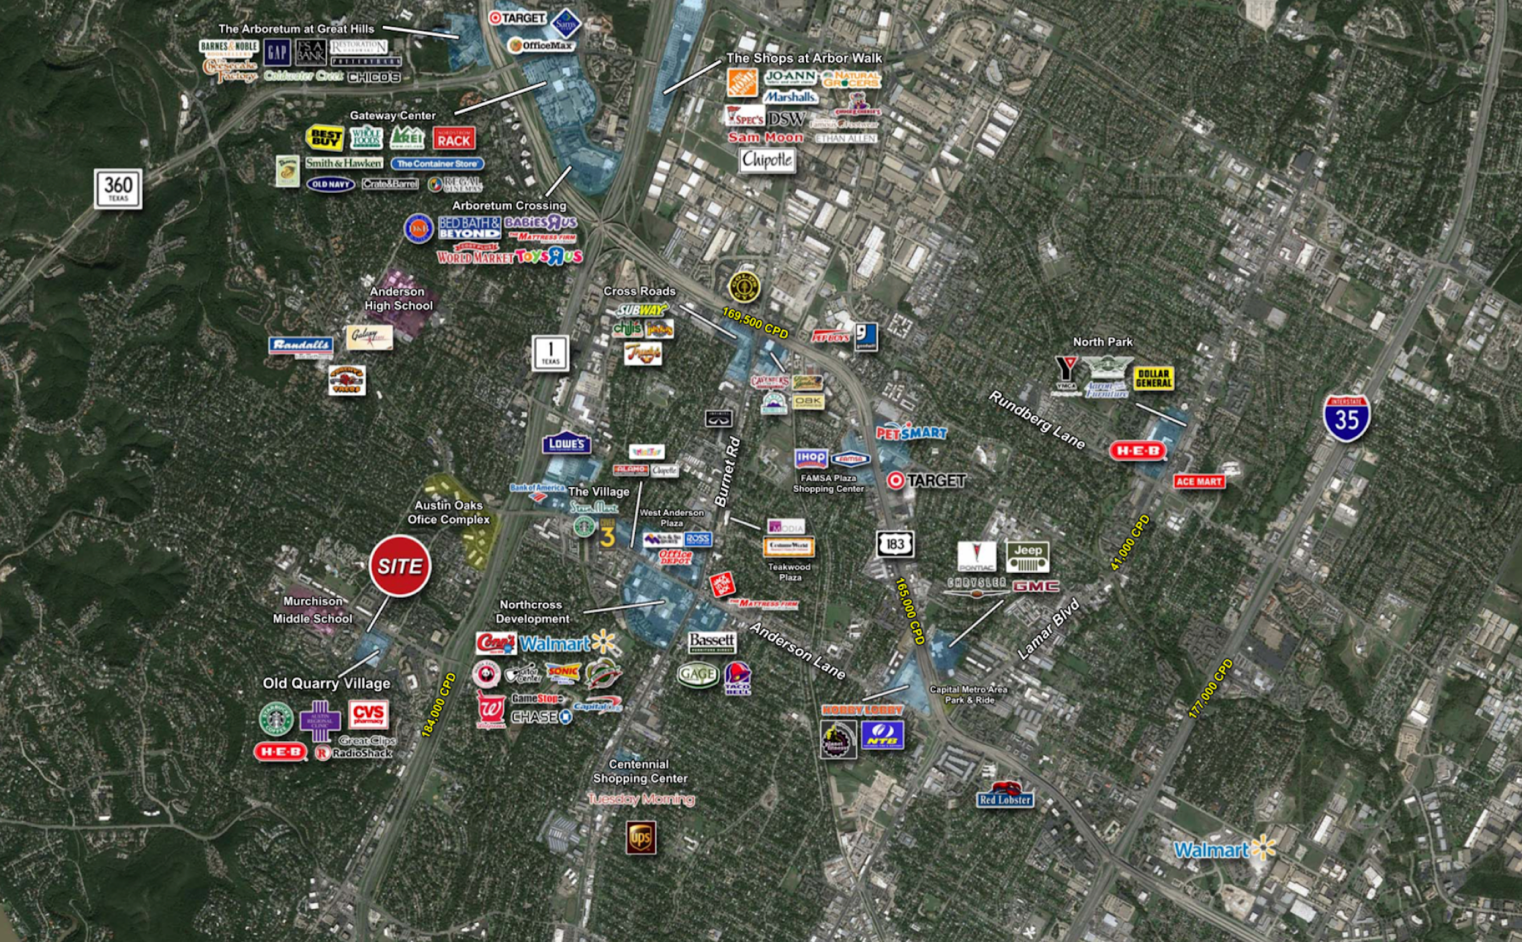
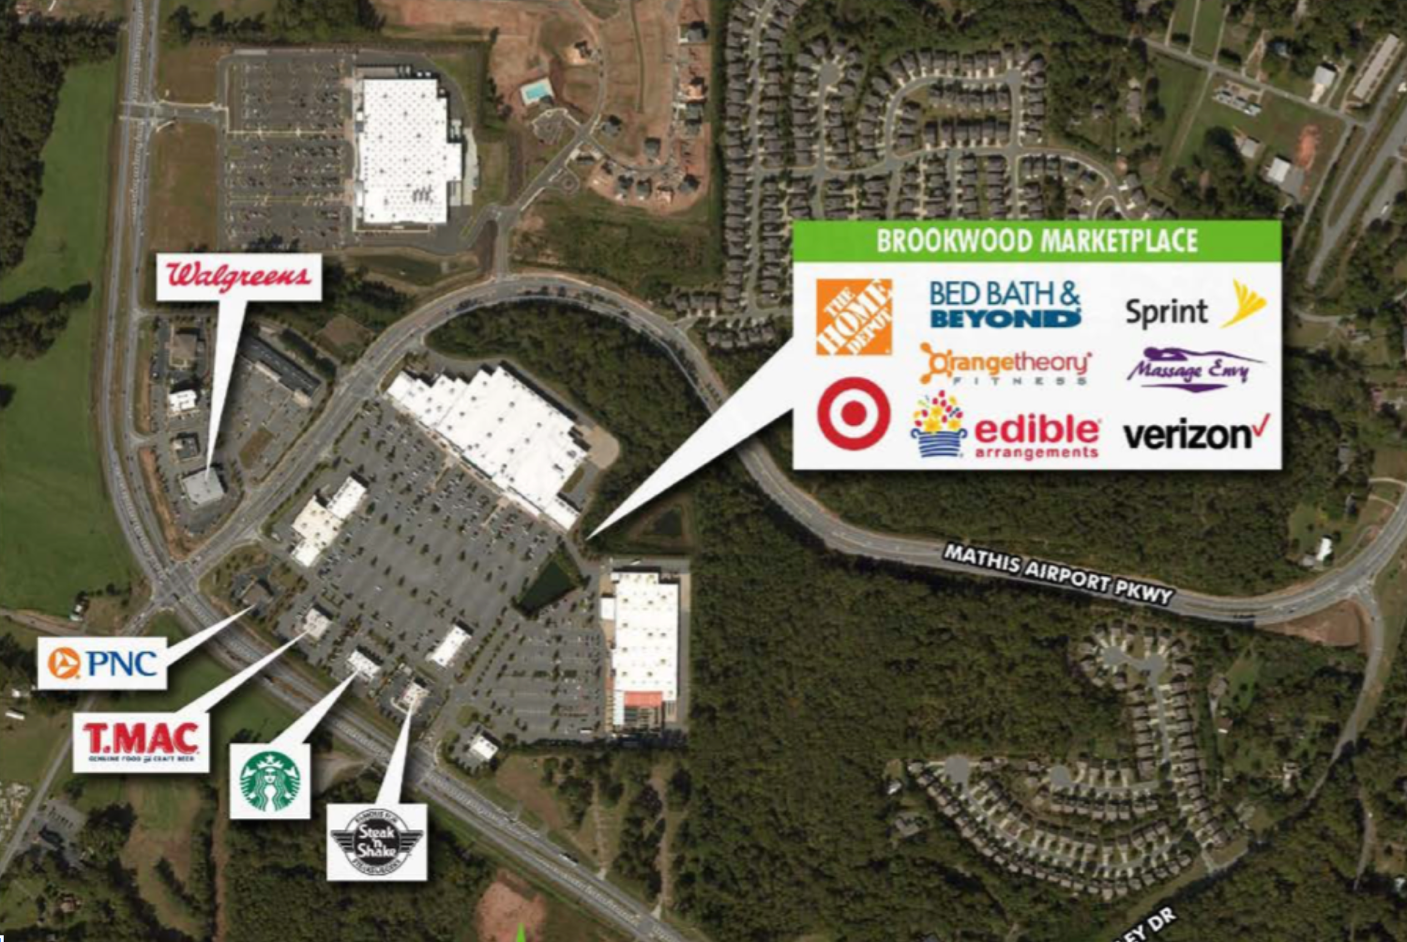
Aerial maps are widely used in the CRE industry. At a high-level, brokers want to get a general sense of whether an area is made up of local businesses or multinational corporations. At the same time, they want to dive deep and know about every single establishment in the area to be able to recognize category voids, identify brand peers, and to be granularly informed.
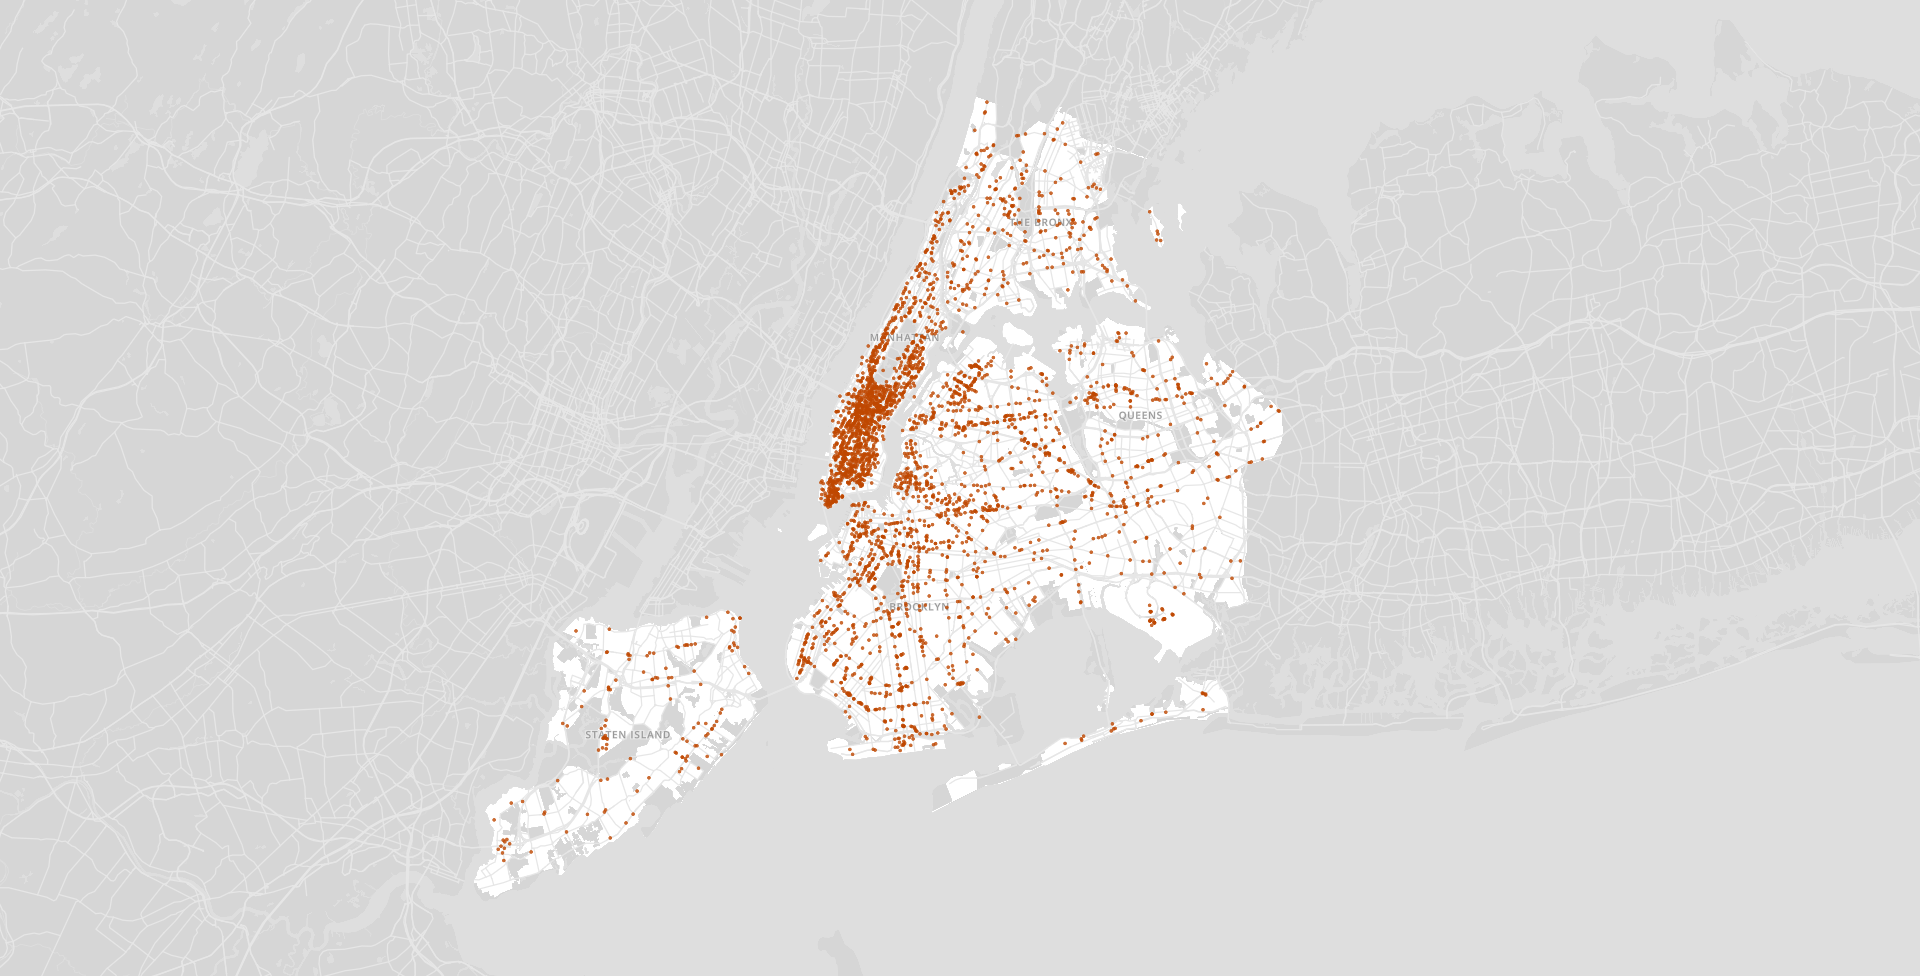
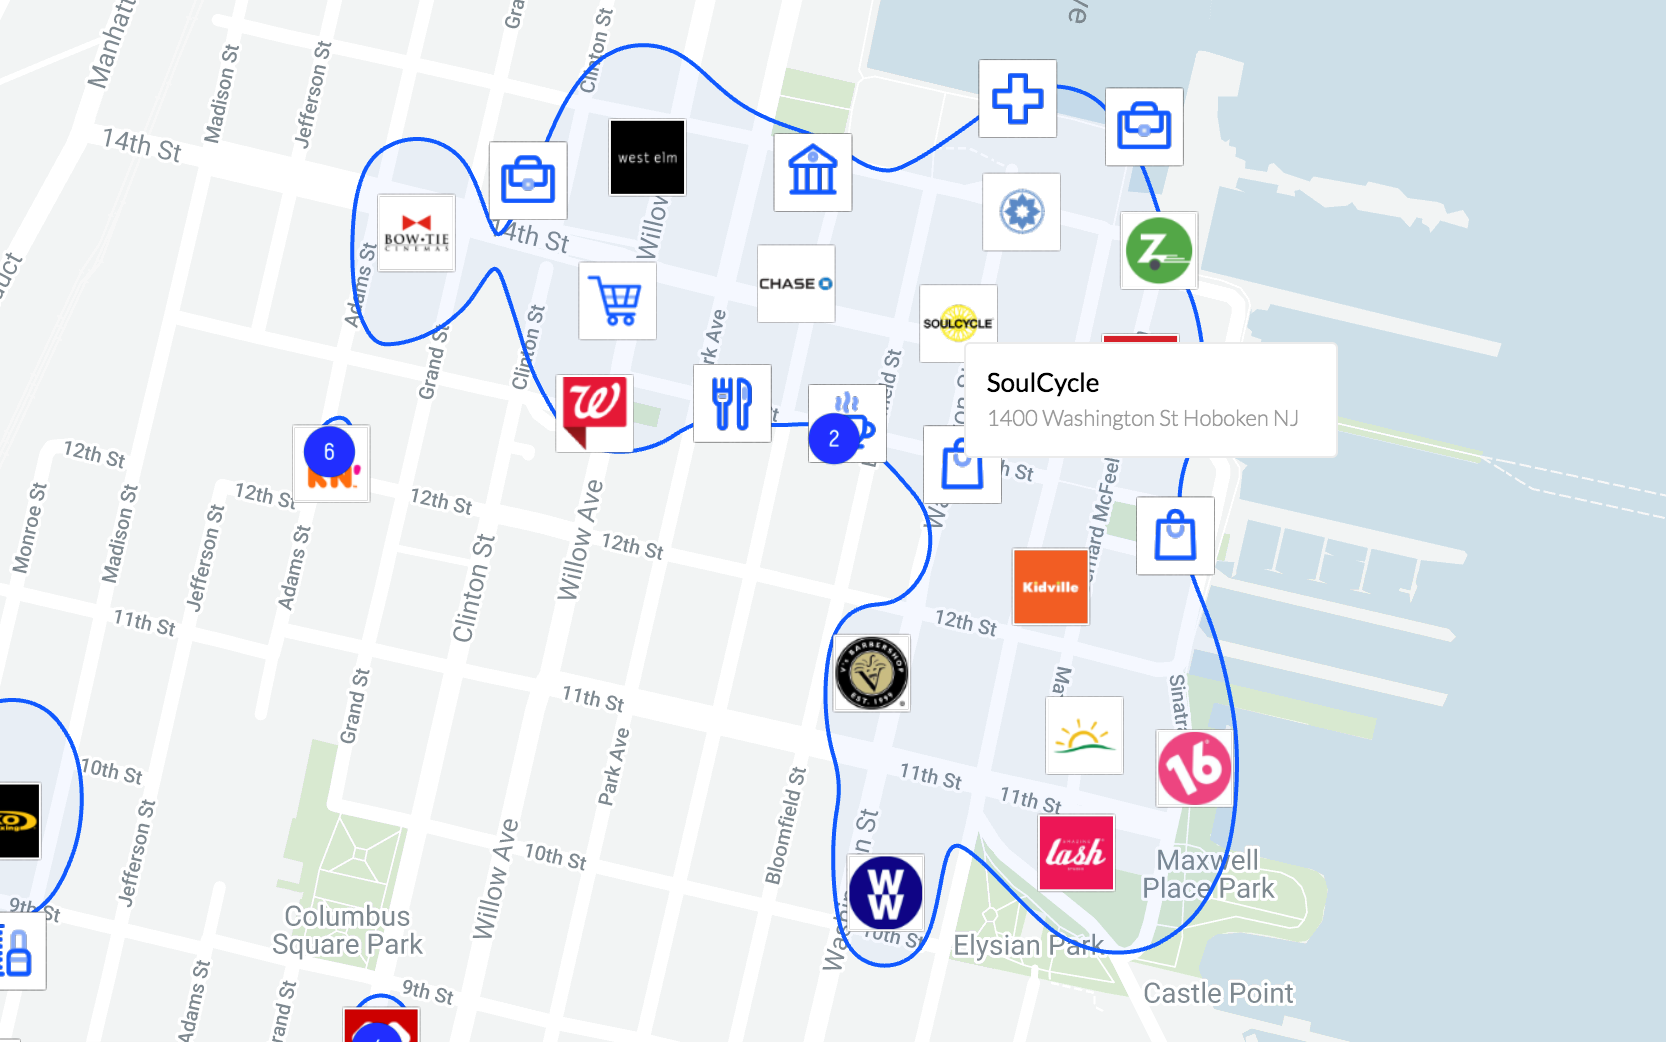
What I came up with as a replacement for aerial maps is a map layer populated with brand logos that prioritizes brands based on their number of nationwide locations and by the amount of metadata we have for that establishment. In other words, when zoomed out, the map shows the more well-known brands and hides the others. Once you zoom in, the hidden logos will begin to show.
The advantages of the Occlusion Layer over a static aerial map are that (1) you can dynamically use the map to zoom in or out as far or as close as you’d like, (2) the map will automatically update whenever a store opens or closes, and (3) you can instantly generate a map like this for any location in the United States.
This map layer was built using Deck.GL and Flatbush (an efficient implementation of the packed Hilbert R-tree algorithm for specially indexing points). In addition, the technology to set a customizable trade area was built using Nebula.GL and the HERE Api for travelshed isochrones.
Tenant Recommendations
The crux of the landlord rep flow is to help brokers find potential tenants. Using the location patterns for thousands of brands in the US, we built a model that, given an address, recommended a curated list of prospective tenants. These recommendations were supposed to replace a broker’s intuition with some honest data-driven choices.


The task of displaying these recommendations however, turned out to be a real challenge. The first problem we faced was that there are hundreds of reasons for why a brand might not fit at a particular address — the property is too small or doesn’t have a kitchen, the address isn’t on the street corner, a landlord is only interested in leasing to restaurants, or the broker already represents a competitor with a store only a few blocks away. The second problem was that, if a recommended brand defied our user's intutition, it eroded trust in the system.
To solve the first problem, we decided to display a long hit-list of recommendations along with a set of intelligent filters. We originally assumed that brokers would be overwhelmed by a list of hundreds of brands, but by allowing brokers to filter by brand characteristics (ex. stylish, trendy, digitally-native), square footage, category, and more, we made the list easy to search and navigate. Now, our algorithm doesn't need to account for all the endless and nitpicky reasons for why an landlord and tenant might not be a good match.
To solve the second problem, I designed and built a view that added quick justifications for why a brand appeared in the list. Inspired by Netflix’s “because you watched …” and Spotify’s “because you listened to …” form of recommendations, using justifications like “Because Bluestone Lane is nearby, here are more Trendy Brands” helped build trust in the recommendations.
Clicking into any of the brands in the list would lead to a page with a nicely designed printable report containing information about the brand and information about why the brand fits at the address.
Tenant Rep Flow: Starting with a brand
The Tenant Rep flow is designed for brokers who are representing a brand. Since these brokers need to both hatch entire national marketing strategies as well as granularly understand the micro-neighborhoods of a city, this flow provides a hierarchy of location recommendations — city-level, neighborhood-level, and street-level recommendations.
A neighborhood-level recommendation score is essentially the flipped version of the algorithm used in the Landlord Rep flow, and a city-level recommendation score is a simple aggregate of the top neigbhorhood scores in the city. Street-level recommendations is where I had to put in the work.
Street-level recommendations and the fluid zones algorithm

d3-contour
My task was to both generate and display street-level recommendations on the fly for a brand in a given neighborhood. By using brand co-location patterns across the US, the algorithm I created was able to use d3-contour to find commercial corridors and score them by how well a brand might fit into the corridor.
The algorithm I designed goes as follows: (1) fetch all the commercial points of interest in the selected neighborhood; (2) weight each point according to how often the selected brand has previously located with that business — or category of business; (3) Generate a weighted density contour plot of the points; (4) For each disjointed group of contours, select the densest contour, and draw it on a map.
This algorithm generated zones looked like this:

While the zone shapes look a little funky, they happen to be the most granular street-level recommendations out in the Commercial Real Estate market. The next step towards improving these might be to actually highlight the street geometries and atomic polygons underneath the fluid contours rather than displaying the contours themselves.
The ethics of recommendations in Commercial Real Estate
Now that I’ve gone through the different parts of FIT and the role I played in building it, one important topic that I haven’t touched on is the ethics of providing a recommendation engine in the commercial real estate market.
There are far too many examples of large multinational corporations leasing a new space and either triggering or speeding up gentrification. There are also studies out there showing that Dollar Stores continuously locating in poorer neighborhoods is contributing to the perpetual economic stagnation of those neighborhoods. A business may fit a neighborhood based on it’s current and previous commercial location patterns, but that doesn’t necessarily mean the people in the neighborhood want it around.
A commercial broker’s incentive is money. For the most part, they don’t necessarily think about how the inclusion of a brand in a neighborhood will affect the people there. They either don’t think about, and sometimes actively avoid, any long-term ramifications of their choices. That’s why I am excited about the potential for FIT to actually make a difference. In an ideal world, the FIT platform is providing brokers with such great convenience and profitability that they would continue to use it even if it provided them with highly curated lists with high ethical standards.
Figuring out what neighborhoods need calls for ongoing research on the effect of certain retail chains on gentrification, an awareness of the specific problems that are affecting different neighborhoods, and direct communication with the people who live in those neighborhoods. There are low-hanging fruit choices that we added to the algorithm (such as removing all dollar stores from the system and heavily promoting small businesses), but so much more can be done.
FIT is still in its infancy, but if we can convince brokerages to adopt it, it can have a significant impact.