Back to all work
The Next Wave: Predicting the future of coffee in New York City
September 7, 2017
Company: Topos
Collaborators: Will Shapiro, Mahir Yavuz
Roles: data visualization, algorithm design, data science
In this article I take a look at New York City through the lens of coffee in an attempt to explore a fundamental question of spatial economics: how are the locations of businesses determined?

The geography of economic activity is a critical force that shapes cities around the world. From infrastructure to housing, urban transformation is often influenced by the location of specific businesses. Coffee shops in New York City are no exception.
Using data from dozens of different sources and techniques from a wide range of technologies and disciplines including game theory, machine learning, natural language processing, statistics, and urbanism, I formulated a model that predicts optimal coffee shop locations in New York City. The findings reveal that the Bronx, Queens, and Brooklyn all show more economic promise than Manhattan, and resonate with recent population and job growth outside of Manhattan. In this article, I'll describe the iterative development of my predictive models and reveal specific forecasts of what the future of coffee in New York City might look like.
But First, A Little Background…

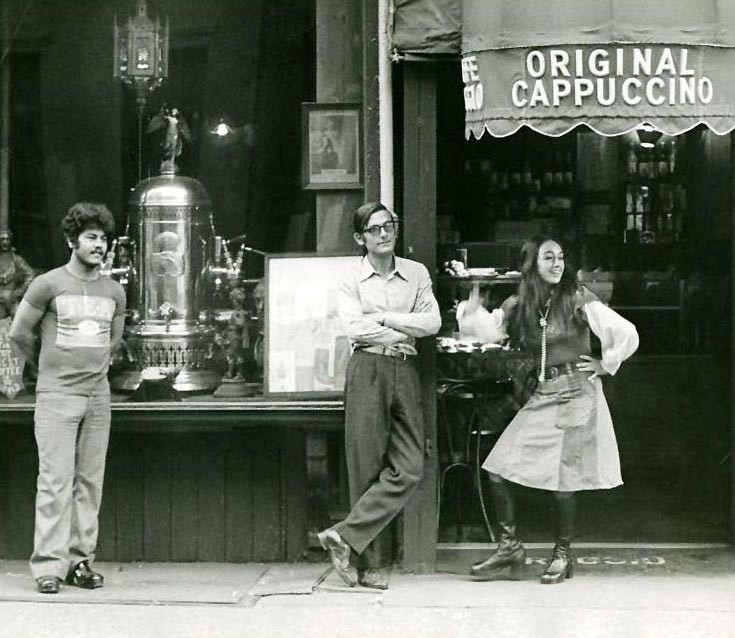
Caffe Reggio in 1974 (Credit: Caffe Reggio)
New York City revolves around coffee. Considering there are 3,389 coffee shops in NYC, it is no wonder the city never sleeps. Dating back to the mid-1600s, while other colonies preferred drinking tea, New Yorkers were primarily drinking coffee. In the early-1800s, New York was one of the largest coffee roasting centers in the United States. More recently, mobile startup MassiveHealth found that New Yorkers drink 6.7 times the amount of coffee consumed by the average denizen of any other US city. If you’re a New Yorker, you’re probably drinking a cup right now.


Left: The Anthora plays a recurring role in Law and Order: SVU reminding us that the show is set in New York City (NBC). Right: Leslie Buck (New York Times)
Coffee has been so central to New York City that one of its serving vessels — the classic ‘Anthora’ cup designed by Leslie Buck in 1963 — has become an icon of the city. Despite this enshrined position, coffee culture in NYC is anything but static; while it is still possible to buy coffee in an Anthora from a street cart or bodega, it is by no means the dominant paradigm. Like elsewhere in the US, New York’s coffee scene has ridden various “coffee waves”. Today’s NYC coffee landscape is hugely varied. And while I won't take a stand on contentious topics like the emergence of the 4th wave, taking into account the diversity of the NYC coffee scene is core to the modeling efforts.
My Approach
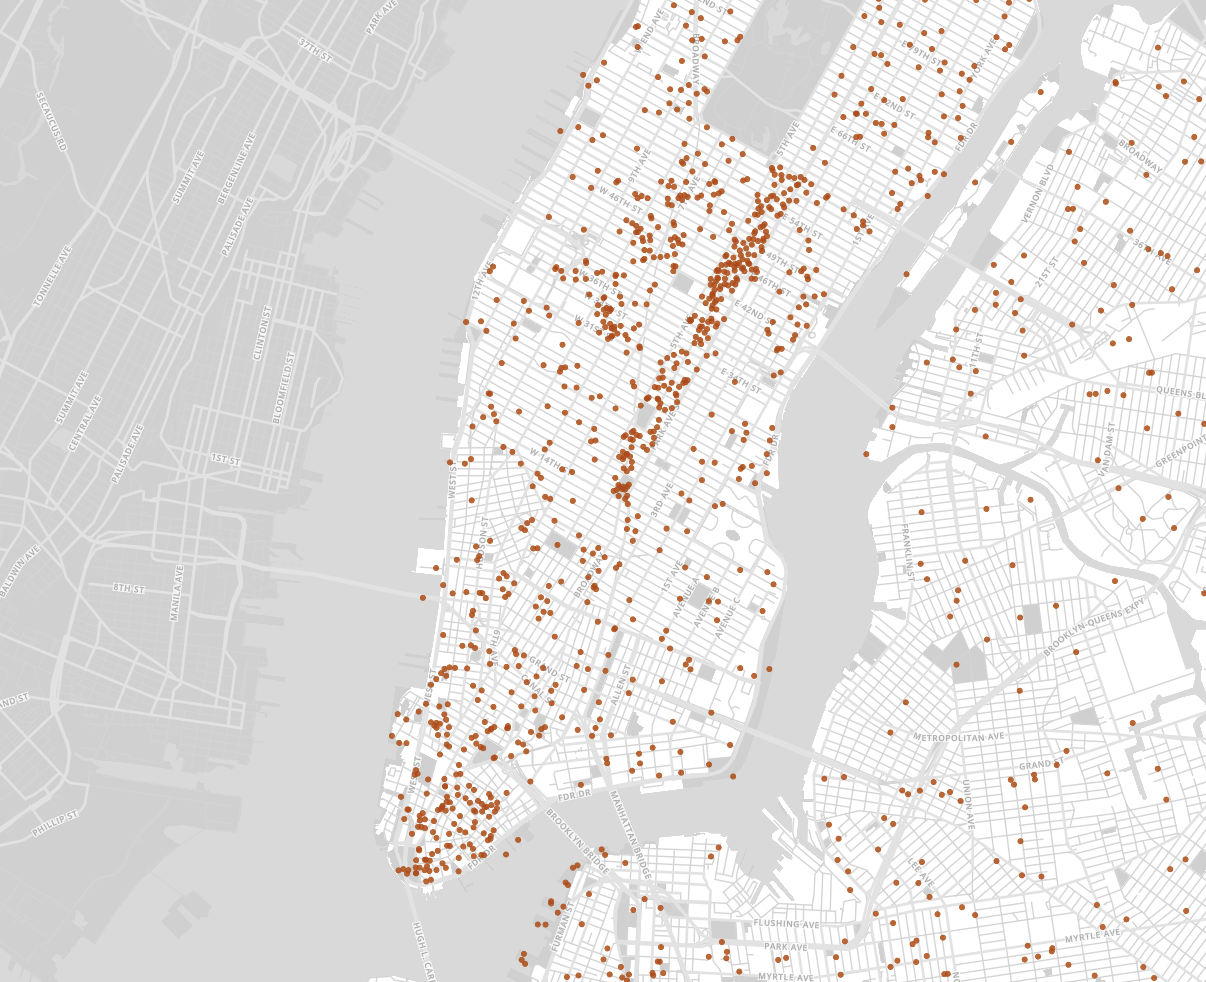
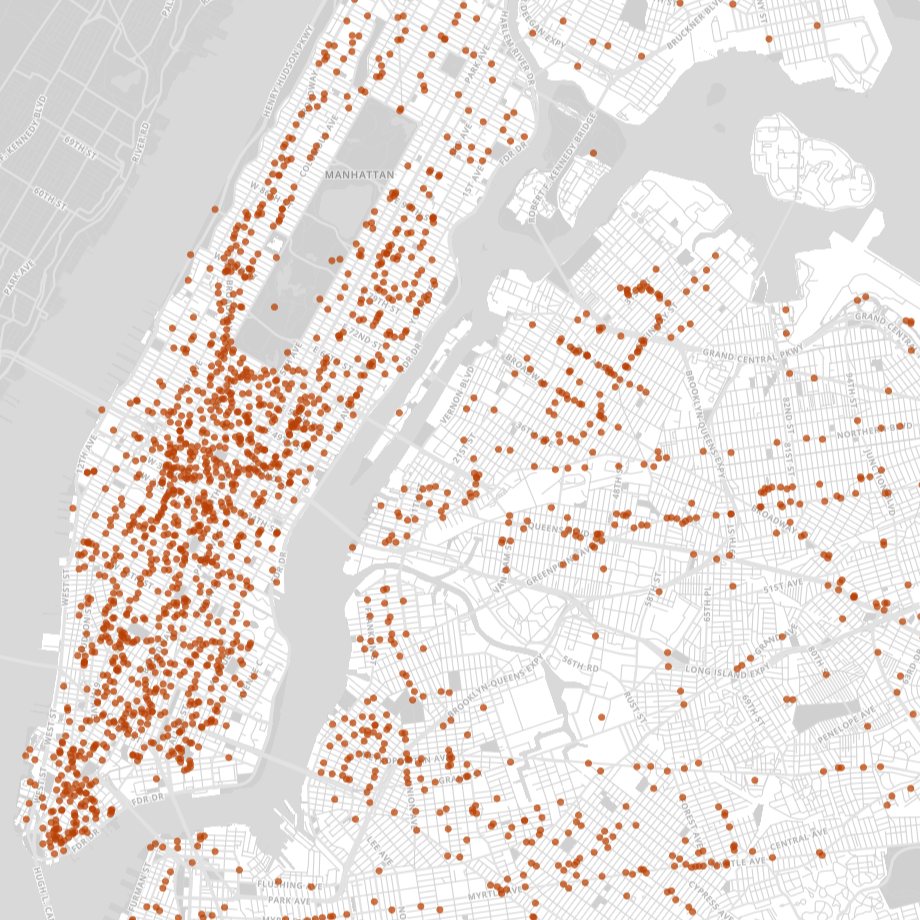
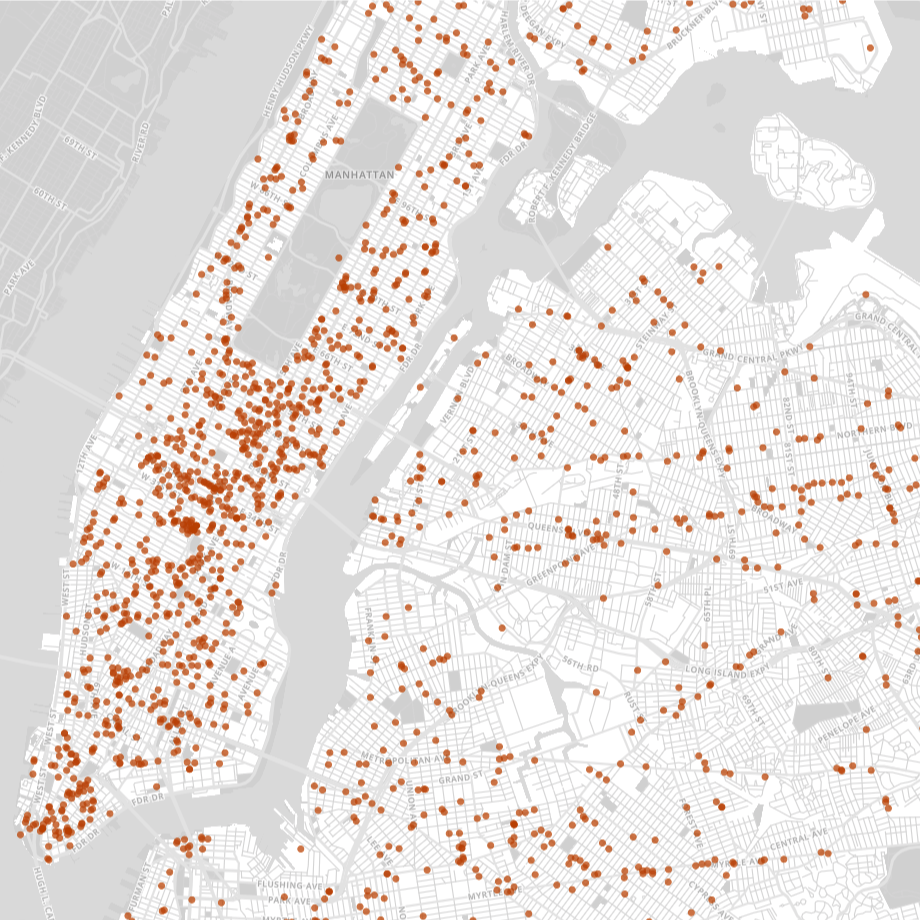
The map below displays all 3,389 coffee shops in NYC (excluding restaurants, supermarkets, and other stores that might also sell coffee). Each point on the map represents a location-based business decision, and it is immediately clear that some areas in NYC are more popular than others (with Midtown and Lower Manhattan leading the way).

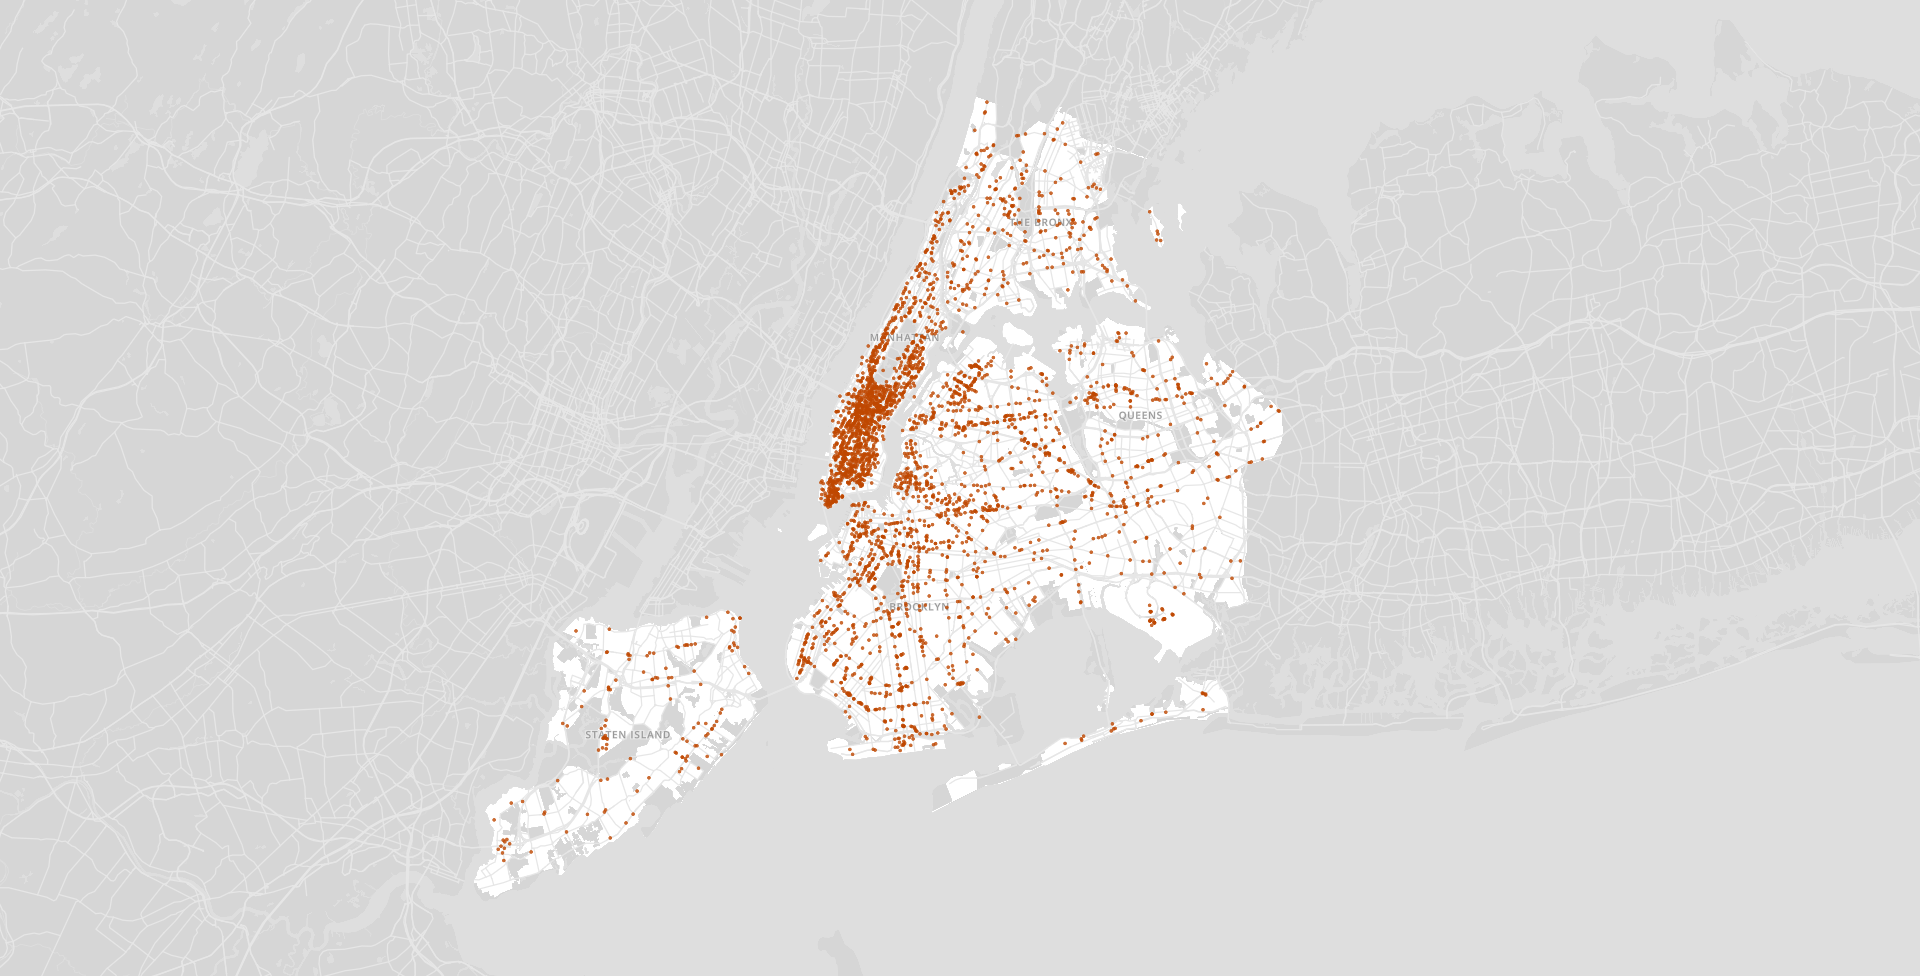
Existing coffee shops in New York City
To understand why coffee shops establish themselves where they do, I asked myself: What makes one neighborhood more appealing than another? Why do coffee shops tend to cluster in the same areas? Are existing coffee shop locations optimal for business?
To answer these questions, I constructed a model that simulates the coffee shop landscape in NYC. Using ideas from Game Theory as a foundation, the process can be divided into:
- Inputs: what key factors influence a coffee shop’s location?
- Simulations: iterative model refinement, based on different inputs.
- Predictions: optimal locations of future coffee shops in NYC.
Inputs
As consumers, deciding where to buy coffee is relatively easy. For the most part, our decisions come down to a trade off between preference, affordability, and convenience: how far will you travel and how much will you pay to get coffee from your favorite coffee shop?
As coffee shop owners, deciding where to locate is more complex. Should you set up shop near Bryant Park (Manhattan) despite an oversaturated competitive landscape? Should you locate in a less competitive area like Tottenville (Staten Island) despite lower customer density? Should high-end coffee shops go to Gramercy (Manhattan) since apartment rents are higher than other parts of the city?
In order to postulate a general set of factors for predicting coffee shop locations, I started with the well-known “Hotelling Location Model” (1929) and its Principle of Minimum Differentiation. The Hotelling Model springs from the idea that vendors choose locations based on proximity to customers. Using this strategy, competitors tend to locate close to the same place — in the middle of all potential customers. This resonates with the map above: NYC coffee shops overwhelmingly cluster in Midtown and Lower Manhattan, the two densest parts of the city.
While Hotelling’s theory is useful for understanding how distance to customers and competition affect business locations, there are limitations. Hotelling assumed that all vendors have identical offerings, a far cry from NYC coffee in 2017. Some revisions of Hotelling’s theory even claim that competitors with different offerings tend to pick locations as far away from each other as possible in order to create monopoly power. Thus, I will also be considering the factors that differentiate coffee shops — quality, price level, and coffee shop culture.
Finally, since we’re modeling real world locations (with zoning restrictions and surrounding neighborhoods) I'll include available commercial locations, neighborhood culture, and neighborhood wealth in the models.
Simulations
Coffee shops are allowed to relocate until reaching a ‘near-Nash Equilibrium’
I began developing the simulation with a basic set of equations that stuck close to Hotelling’s original distance-based formulation. For each equation, we have variable weights (Wu1, Wu2, etc) that I can algorithmically tune, refining the models iteratively to produce more realistic results.
Utility of coffee shop C. Let's define the utility function to be the tradeoff between the quality of coffee shop C and distance to coffee shop C:


where the Quality of C is determined by aggregating user reviews of C from a variety of sources)
Probability of a customer going to coffee chop C. Let's define the probability of a customer choosing coffee shop C to be the Utility of C divided by the Sum of the Utility of all other coffee shops in the area of C:


Expected number of customers for coffee shop C in neighborhood N. We can estimate the number of customers a coffee shop C would have if it were to locate in a given neighborhood N by taking the sum, across all neighborhoods n of the product of the Probability of Choosing C in n times the population of n. Or more succinctly put:


With these equations in hand, I ran through the 3,389 coffee shops in New York City and sequentially located each one in an optimal neighborhood by allowing coffee shops to relocate until reaching a near Nash equilibrium. This provided our first results.
First Attempt — Residential Population Oversight

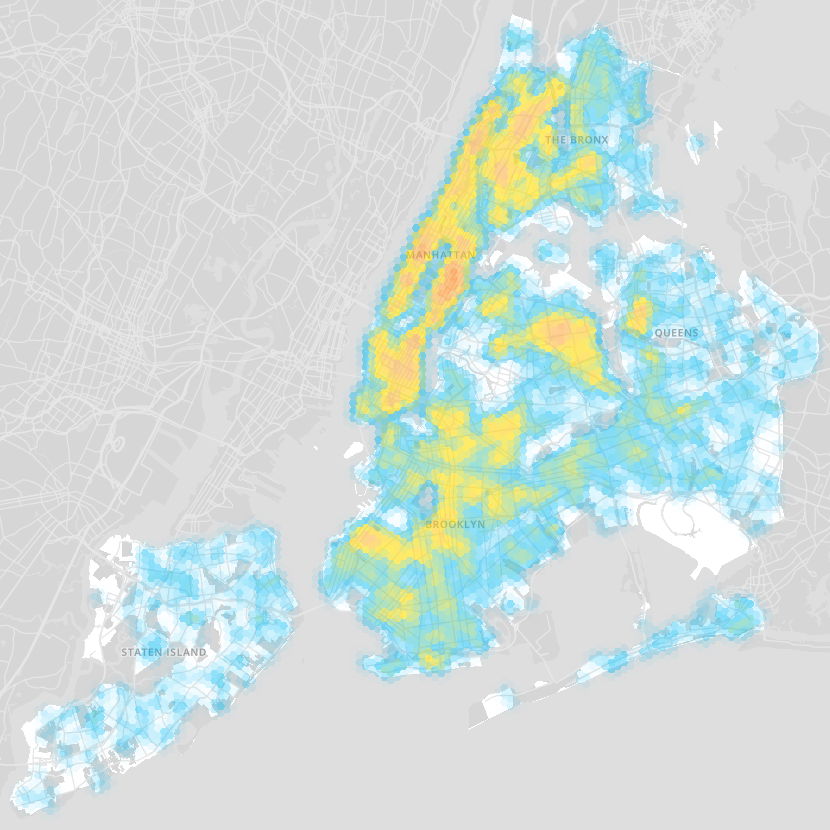

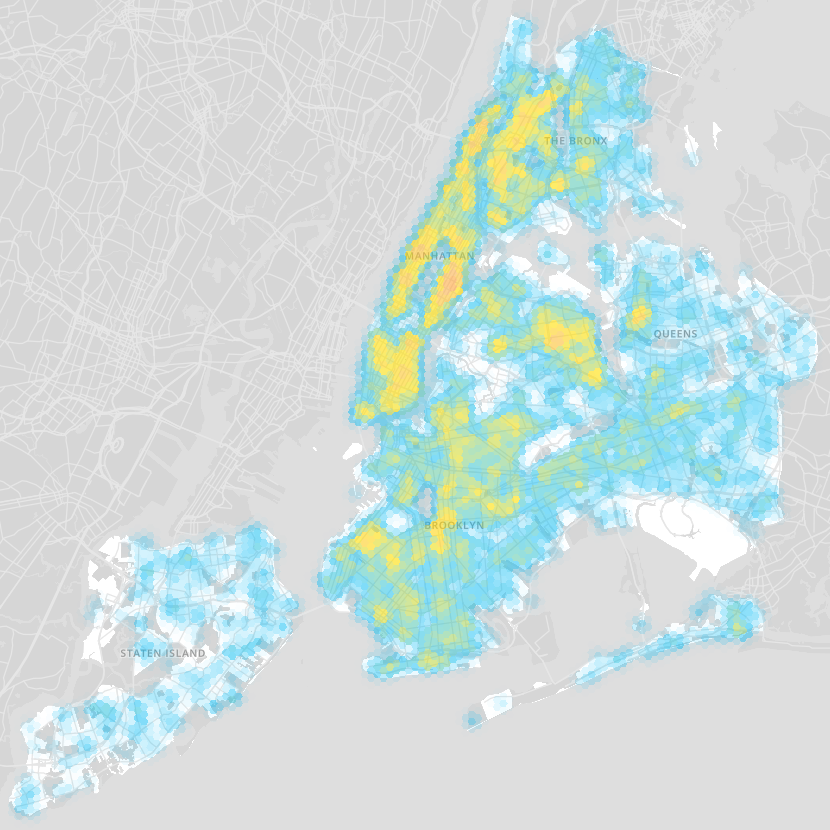
Left: Residential population of NYC, Right: First simulation results
The first simulated results had little to do with the current coffee shop mapping of NYC, though it did bear a striking resemblance to mappings of residential populations across the city. This failing makes sense in light of one of coffee’s core features: it is a daytime drink. Thus the first refinement I made to the model was to use the daytime (rather than residential) population of neighborhoods in the model.
Second Attempt — Daytime Population Fix
3D visualizations of Left: Residential population of NYC and Right: Daytime population of NYC
Incorporating daytime population into the model produced an intense concentration of coffee shops in lower and midtown Manhattan, and resulted in a map that came closer to reality. However certain areas (Fifth Avenue, Wall Street) were clearly oversaturated, with coffee shops occupying an impossible number of adjacent locations.

I addressed this problem by incorporating one of the key inputs discussed above: coffee shops should only be allowed to locate in commercially zoned spaces.
Third Attempt — Commercial Locations
Incorporating commercial zoning into the model produced a map that again came closer to the current NYC coffee landscape. The oversaturation of Central Park South and Wall Street was ameliorated, and placement of coffee shops outside of Manhattan started to articulate main thoroughfares, capturing neighborhood life in the outer boroughs.
While I was happy with the placements in aggregate, I hadn’t yet taken into account perhaps the single most important economic factor: price.
Fourth Attempt — Optimal Pricing
I incorporated price into the model by revising the Utility function, setting:


Adding price as an input to the model necessitated a refinement of the success metric — rather than number of customers, total revenue now defined success.
I then allowed coffee shops to set their own price, resulting in a trade off: As coffee shops set their price higher, they make more money per customer, but risk having fewer customers.
Furthermore, to account for the wide variations in NYC pricing (of meals, rentals, houses, etc) I included a composite Neighborhood Economy Index as an input; therefore the pricier a neighborhood is in general, the less the price of coffee matters in the model.
While the overall location selection closely resembled reality (as it did in the previous model), the geographic price distribution was far off. In particular, simulated coffee prices in Manhattan were significantly lower than they should be, due to the following set of implications:
High density of coffee shops in Manhattan → High level of competition in Manhattan → Lower prices in Manhattan
As it turned out, this failure was instructive, resonating with a truth familiar to anyone who has bought a pour-over coffee in the East Village in 2017 — In Manhattan, coffee shops do not compete on price, they compete on culture.
Fifth Attempt — Cultural Fit
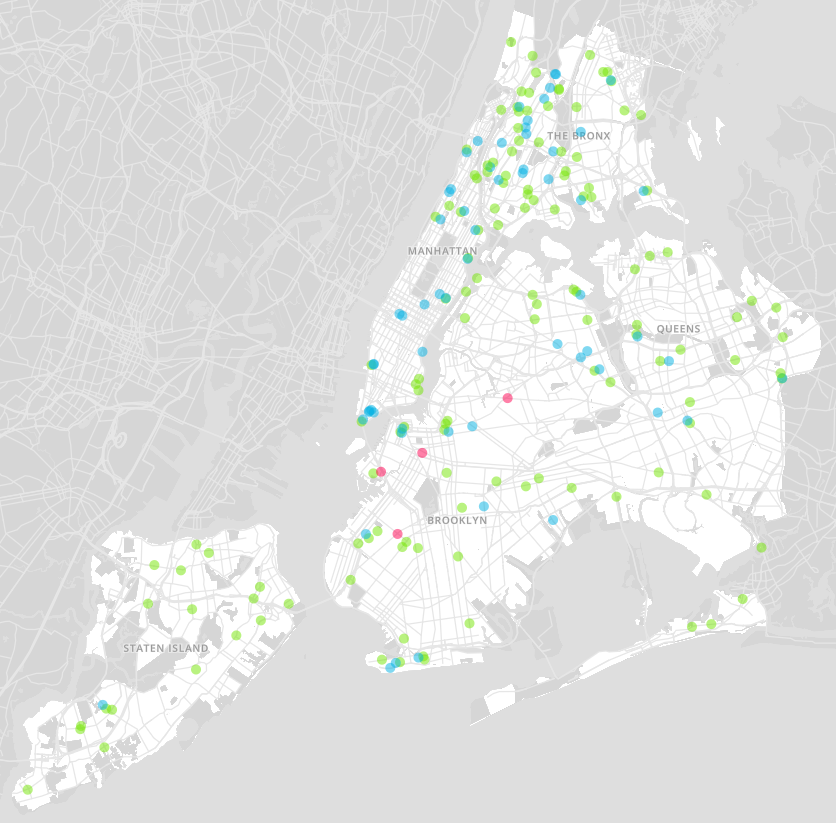
Brown = Undifferentiated by Culture, Green = Local, Blue = Mainstream, Pink = Third Wave
La Colombe and Dunkin’ Donuts do not compete solely on price because they present radically divergent cultures (and products) to consumers. Individual coffee shops target different segments of the population — A third wave coffee shop might do well in Bushwick, but will likely avoid Times Square. Dunkin’ Donuts may find more success in Times Square and want to stay away from the L train, where it has been less than welcomed.
To account for these differences, I divided coffee into three (sure to be contentious) groupings: Mainstream (Blue in maps; Dunkin’ Donuts, Starbucks, 7-Eleven…), Third Wave (Pink in maps; Stumptown, La Colombe, Blue Bottle…) and Local (Green in maps; NYC only).
Leveraging Topos’s suite of features and indices (which capture a ‘Psychographic’ portrait of every neighborhood) I was able to compute the cultural fit of each coffee shop C for every NYC neighborhood N. I then further revised the Utility function to take into account cultural fit:


As with other simulations, I allowed each coffee shop to relocate until reaching a near Nash equilibrium across all factors. This equilibrium condition ensured that neighborhoods don’t become oversaturated with a particular category of coffee shop, even if that category is the optimal cultural fit.


Left: Actual locations of coffee shops. Right: Simulated results.
As can be seen above, the simulated results came close to the reality of coffee culture in NYC in 2017. Midtown is filled with Mainstream coffee shops. Third Wave coffee shops cluster in Lower Manhattan, Brooklyn and eastern Queens, but rarely in the Bronx and never in Staten Island. Local coffee shops are not confined to any one area since they all tend to be different. While I undoubtedly could have continued to refine the model to account for ever more detail (Pour over? Kyoto-style cold brew towers? Next-gen coffee sodas?) at this point I felt the model had achieved a level of reality where I was curious what predictions it would make about the future of coffee in NYC.


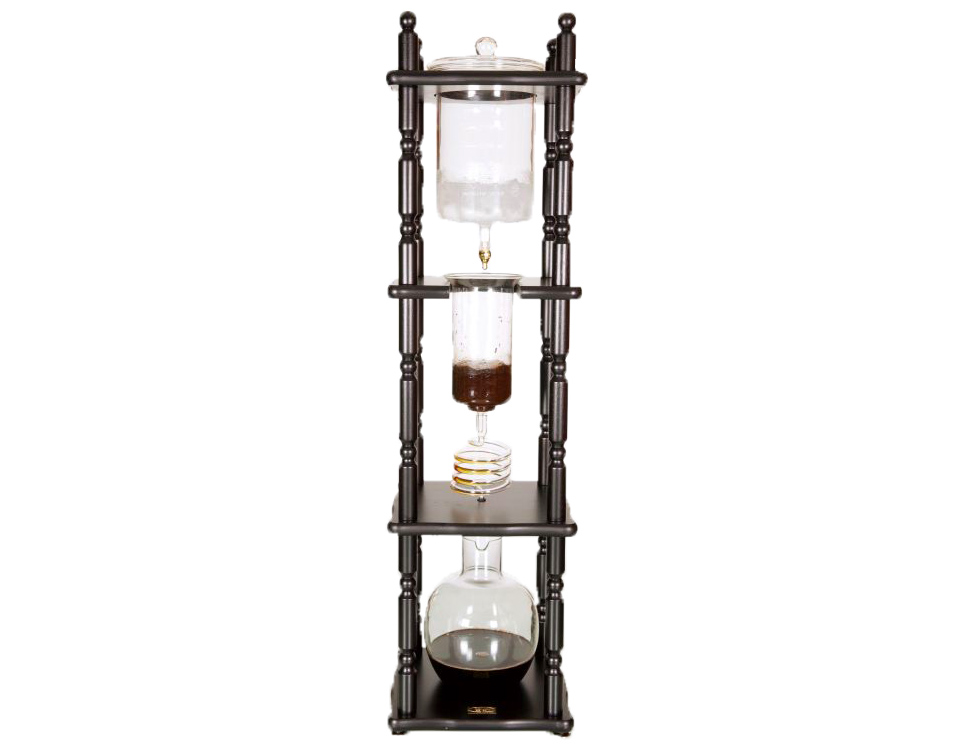


Possible model refinements: Pour over brewing (Stumptown Coffee Roasters), Yama cold brew tower (Yama), Next-gen coffee sodas (Matchless Coffee Soda)
The Next 200 Coffee Shops

The next 200 coffee shops in Manhattan. Green = Local, Blue = Mainstream, Pink = Third Wave
Maintaining the existing ratio of Mainstream : Local : Third Wave coffee shops, I used the model to simulate the optimal location of the next 200 coffee shops to open in NYC.
At a high level, the most surprising insight was the low number of predicted coffee shops in Manhattan.
In contrast, the Bronx presented a wealth of opportunities, claiming the largest share (31%) of the 200 simulated points. This resonates with the Bronx’s recent surge in population and jobs in the private sector.
For more cultural specificity, I decided to plot the next 10 predicted locations for a few coffee categories and franchises.

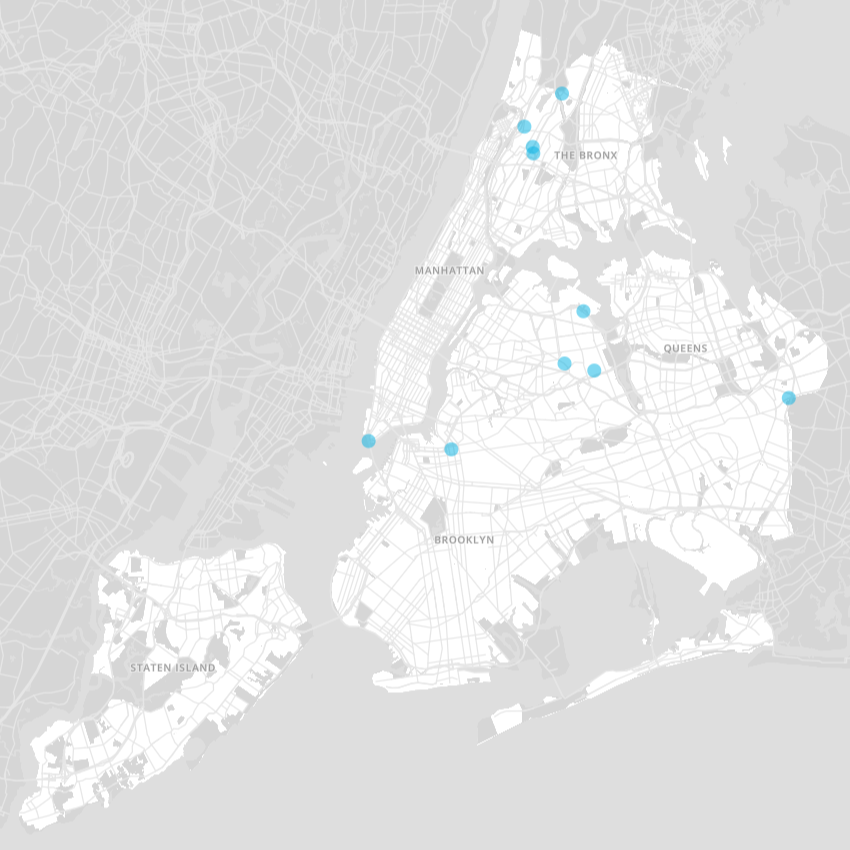
The Next 10 Dunkin’ Donuts
With the exception of Battery Park, Dunkin’ Donuts finds more success moving far from Manhattan, with only a single Manhattan location vs 4 in the Bronx and 4 in Queens.
Bronx: 4; Queens:4; Manhattan: 1; Brooklyn: 1

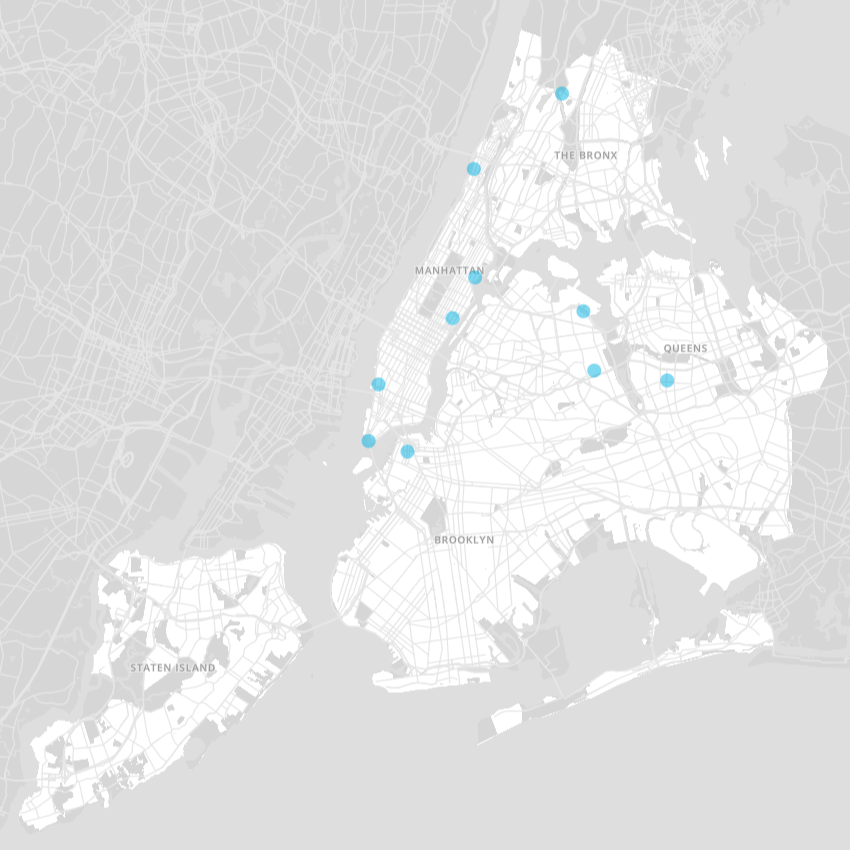
The Next 10 Starbucks
In contrast to Dunkin’ Donuts, Starbucks finds significant opportunity in Manhattan, where its higher prices are less of a factor. Nonetheless, over half of Starbucks projected locations are in the outer boroughs.
Manhattan: 5; Queens: 3; Bronx: 1; Brooklyn: 1

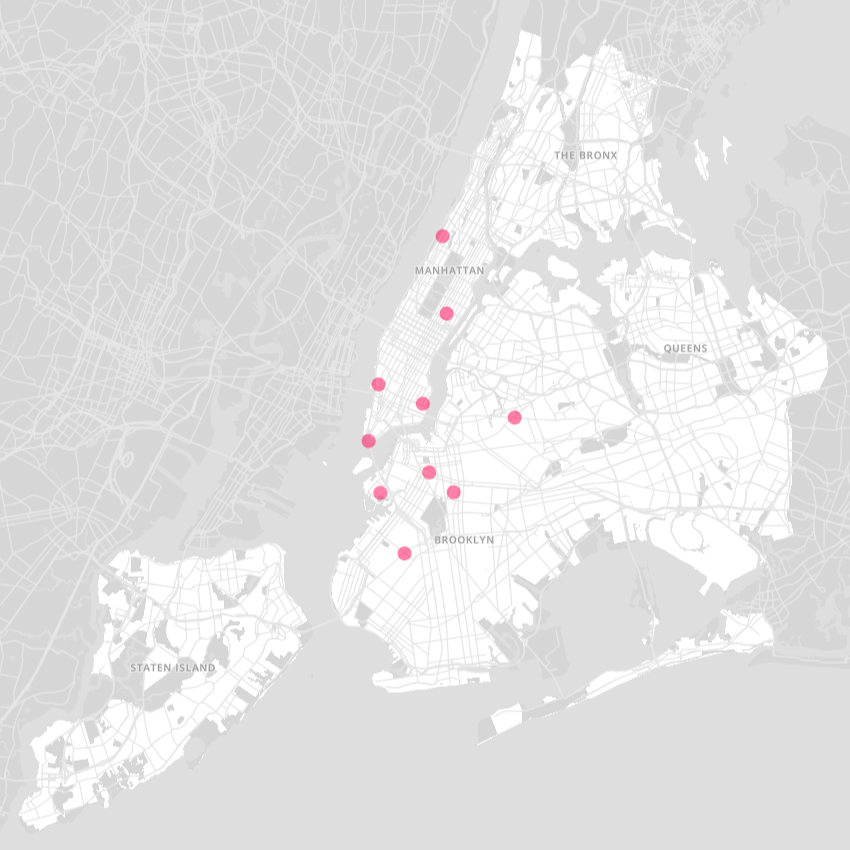
The Next 10 Third Wave Coffee Shops
While Manhattan and Brooklyn still present the most opportunity for third wave coffee shops (as might be expected), it is interesting to note some specific location trends within each borough: upwards in Manhattan, and outwards in Brooklyn. Rather than solely clustering in Lower Manhattan and commuter Brooklyn, we find Manhattan locations moving up towards Harlem and Brooklyn locations moving away from commuter neighborhoods, making it as far as Ridgewood in Queens (which, to be fair, may be the most Brooklyn of Queens neighborhoods)
Manhattan: 5; Brooklyn: 4; Queens: 1

Why Coffee?
Coffee shops are undoubtedly a small piece of the much larger puzzle that is contemporary urban living; yet their importance should not be underestimated. From their influence on the enlightenment to their ever-evolving status as a “third place”, coffee shops — and the culture they participate in, create, and project — have played a vital, often controversial role in shaping urban experience. Thus understanding coffee shops in a variety of ways — from analyzing the language used to discuss particular franchises with NLP to simulating future coffee landscapes — constitutes a small but vital aspect of the work I have been immersed in at Topos. Topos is changing the understanding of cities through the twin lenses of big data and artificial intelligence.


